Spam complaint rate: the limits and how to stay under them
How Gmail and Yahoo calculate your spam rate, what 0.1% and 0.3% mean at 1 million sends, the usual causes of complaints, and the fixes that work.
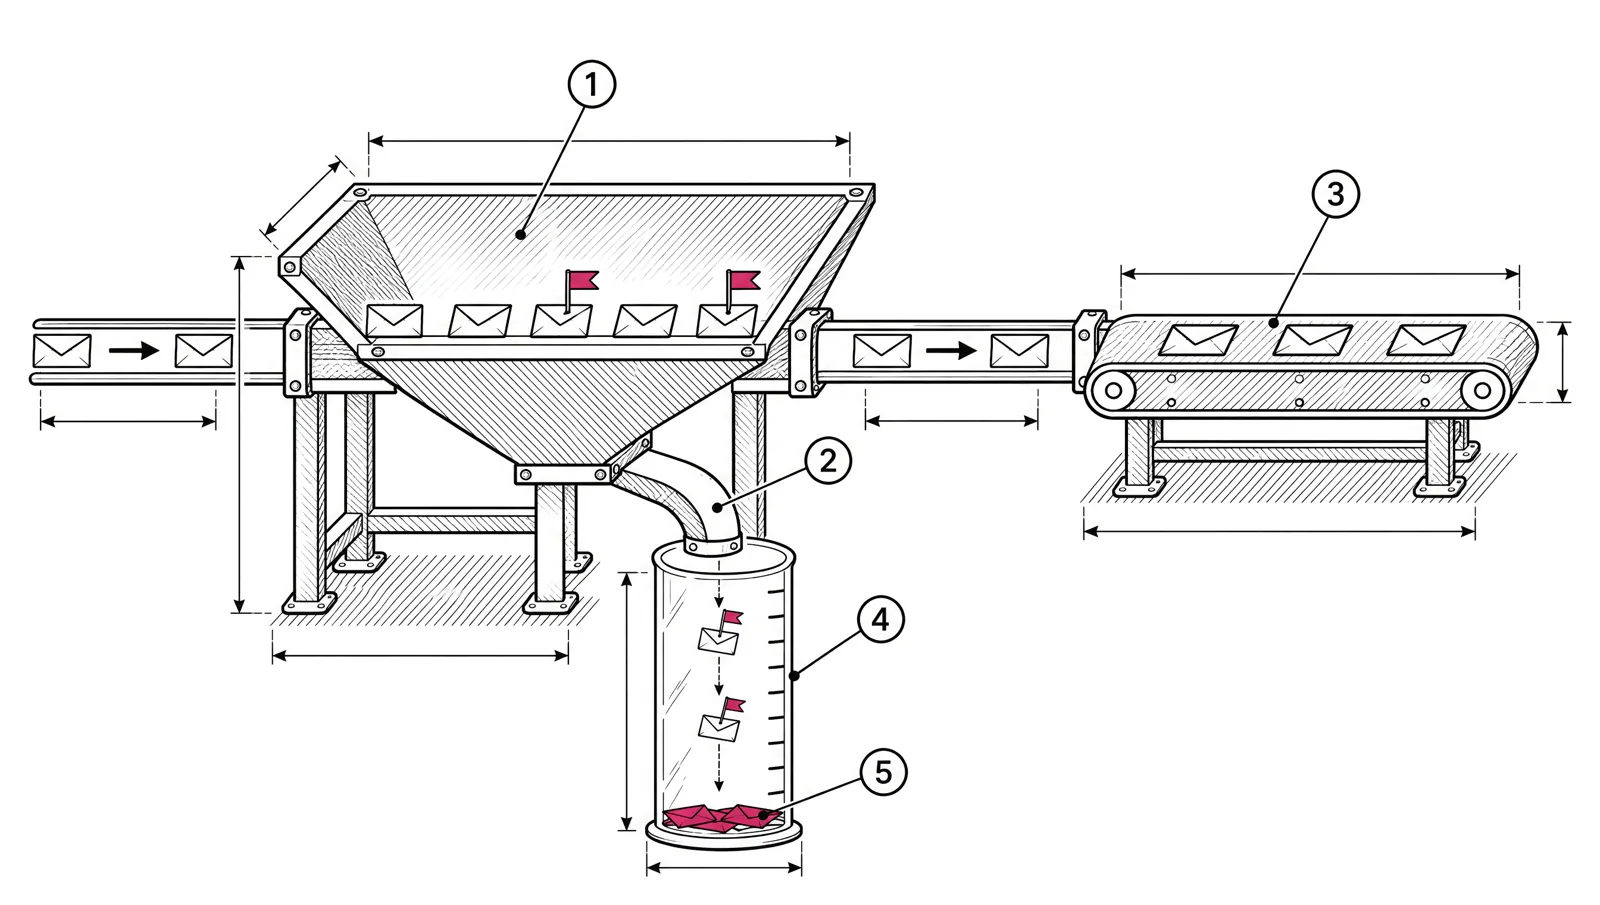
Gmail and Yahoo require your spam complaint rate to stay below 0.3%. Gmail asks you to keep it below 0.1%. Both measure complaints against mail that reached the inbox, so the rate they see is higher than the one most sending platforms show. At 1 million emails a month, 0.3% can be as few as 3,000 complaints, and Gmail checks the rate every day. This post covers how the rate is calculated, the math at volume, what causes complaints and how to bring them down.
The limits
| Provider | Target | Limit | Source |
|---|---|---|---|
| Gmail | Below 0.1% | Never reach 0.3% | Gmail sender guidelines and FAQ |
| Yahoo | Not stated | Below 0.3% | Yahoo Sender Hub best practices |
| Microsoft | Not stated | No published threshold | Outlook.com high-volume sender rules |
The limit applies to all senders at Gmail and Yahoo, not only bulk senders. Bulk senders feel it more, because Gmail ties a consequence to it.
How the rate is calculated
The word “rate” hides the most important detail: what you divide by.
- Gmail Postmaster Tools: the share of your messages delivered to engaged recipients’ inboxes that those recipients then marked as spam. Messages that went to spam and were then marked as not spam count as inbox deliveries. Only DKIM-authenticated mail to Gmail accounts is included, and the rate is calculated daily.
- Yahoo Sender Hub: Yahoo calls its rate “the true rate”, calculated on messages delivered to the inbox.
Most sending platforms calculate something else: complaints received through feedback loops, divided by all delivered messages. That denominator includes mail that landed in spam folders, which people rarely report. It also misses most Gmail complaints, because Gmail’s feedback loop reports rates per campaign, not individual addresses. The result is a smaller number.
Your platform’s rate can sit well below the one in Postmaster Tools. The provider’s number is the one that decides your delivery.
The math at volume
The rate is a ratio, so the number of complaints you can absorb grows with volume. It is also measured per day, so a single bad send can push one day over the limit.
Start with monthly volume. 1,000,000 emails a month, all delivered to the inbox:
- 1,000,000 × 0.1% = 1,000 complaints
- 1,000,000 × 0.3% = 3,000 complaints
Now take a daily newsletter: 50,000 subscribers × 30 days = 1.5 million emails a month. Say 20,000 of those subscribers use Gmail. Gmail sees one day at a time:
| Gmail mail in the inbox that day | Complaints at 0.1% | Complaints at 0.3% |
|---|---|---|
| 20,000 | 20 | 60 |
| 16,000 (4,000 went to spam) | 16 | 48 |
| 5,000 (a smaller segment) | 5 | 15 |
Three things follow from the table.
- Small sends are fragile. At 5,000 Gmail recipients, 15 complaints cross the limit. A re-engagement email to old subscribers can do that alone.
- Spam placement makes it worse. When more mail goes to the spam folder, the denominator shrinks and the same complainers produce a higher rate.
- Volume does not dilute a bad segment for long. A large clean send on Monday does not lower Tuesday’s rate.
What causes complaints
People press “Report spam” when it is easier than unsubscribing, or when they don’t recognise the mail. The common causes, roughly in order of impact:
| Cause | What it looks like |
|---|---|
| People who never asked | Purchased or scraped lists, co-registration, addresses added from a trade show without consent |
| People who forgot | Long-inactive subscribers mailed again, or a list that sat unused for months |
| More mail than promised | Weekly signup, daily sends. Yahoo asks you to keep the frequency the list signed up for |
| Hard to leave | Unsubscribe link hidden in grey 8px text, a login wall, no one-click header |
| Unclear sender | A From name that changes, or a brand the reader does not connect to the signup |
| Content mismatch | Signed up for product news, received sales offers |
How to bring the rate down
Fixes that work, from fastest to slowest:
- Make leaving easy. Add one-click unsubscribe headers and a clear link at the top or bottom of every message. A reader who unsubscribes does not complain. See one-click unsubscribe: the headers and the endpoint.
- Stop mailing people who stopped reading. Build a segment of subscribers who have not opened or clicked in a set period and stop sending to them, or send one re-engagement message first. See a sunset policy for inactive subscribers.
- Suppress every complainer at once. Someone who reported you once will report you again.
- Keep the promised frequency. If you need to send more, ask readers to opt in to the extra mail.
- Use confirmed opt-in. Yahoo recommends it. It removes mistyped and fake addresses before they reach your list.
- Keep the From name stable and the content close to what people signed up for.
- Send the riskiest segments separately and small. Watch the next day’s Postmaster data before you send to the rest.
Feedback loops
A feedback loop (FBL) sends you a report when a recipient marks your mail as spam. Each provider runs its own.
| Provider | Program | What you get |
|---|---|---|
| Yahoo | Complaint Feedback Loop (CFL) | A report per complaint in Abuse Reporting Format (ARF). You enroll your DKIM d= domains |
| Microsoft | Junk Email Reporting Program, part of SNDS | Complaint reports for mail from the IPs you register |
| Gmail | Feedback Loop dashboard in Postmaster Tools | Spam rates per campaign identifier, from a Feedback-ID header. Not a report per address |
Act on every FBL report the same way: unsubscribe and suppress the address, and never import it back. For Gmail, where there is no per-address report, watch the rate in Postmaster Tools and cut the segments that drive it. Reading Postmaster Tools and SNDS in detail is covered in read Google Postmaster Tools and Microsoft SNDS.
A weekly routine
- Check the spam rate in Google Postmaster Tools and the Yahoo Sender Hub for every day of the past week, not only the average.
- Compare it with the complaint rate per campaign in your platform. Find the sends that stand out.
- Check that every FBL complaint from the week is suppressed.
- Look at the segment behind any send above 0.1%. Was it old, imported or mailed more often than usual?
- Update the sunset segment and remove people who passed the cutoff.
Checklist
- Know both numbers: your platform’s rate and the provider’s rate.
- Aim for under 0.1% at Gmail. Treat 0.3% as a wall.
- Work out how many complaints that is for your smallest regular send.
- One-click unsubscribe headers and a visible body link on every marketing message.
- Confirmed opt-in for new subscribers.
- A sunset rule for inactive subscribers.
- Feedback loop complaints suppressed automatically.
- Feedback-ID set per campaign type for Gmail.
- Risky segments sent small and separately.
In EmailMarketer.io, complaints that arrive through ARF feedback loops unsubscribe and suppress the address automatically. Each campaign report shows its bounce and complaint rates, with a warning when they run high. Engagement segments (opened, not opened, clicked, not clicked, with a time filter) make the sunset rule a saved segment. See reports and audience in the feature list, and our deliverability page for how we work with high-volume senders.